Guide
What a £1,000 Pay Rise Is Worth After Tax in 2026/27
A £1,000 annual pay rise is £83.33 a month before deductions. This IsMyPayRight analysis shows how much of it reaches take-home pay at 12 salary levels, under two UK tax regimes and 10 loan arrangements.
Quick answer
In England, Wales and Northern Ireland, a rise from £30,000 to £31,000 leaves £720 a year with no loan or pension contributions, or £570 with Plan 2 and postgraduate repayments. The same gross rise can leave a very different net amount near a tax threshold. These are modelled annual examples, not survey findings or exact payslip predictions.
What this analysis measures
Published 26 September 2026 · Version 1.0 · Tax year 2026/27. These are 240 deliberately chosen scenarios: 12 starting salaries × two tax regimes × 10 loan arrangements. They are not 240 people, a population sample or an estimate of the average worker’s experience.
Each case compares a full year at the original salary with a full year at £1,000 more. We include Income Tax, employee NI and the specified loan repayments. All cases assume standard Personal Allowance rules, including the taper, NI category A and no pension contributions, salary sacrifice or other income. Loans are assumed to be in repayment throughout with sufficient balances outstanding.
We exclude the Child Benefit charge, benefit withdrawal, childcare eligibility, employer costs and inflation. The result is extra take-home pay under these assumptions, not a complete change in household spending power. A mid-year rise or one-off bonus needs a different payroll calculation.
Three findings worth understanding
1. A loan plan can change the value of a rise before it changes your tax rate. At £25,000 in England, Wales or Northern Ireland, a rise to £26,000 leaves £720 with no student loan or with Plan 2, because both salaries are below the Plan 2 threshold. With Plan 5, the same rise leaves £630: £90 goes to loan repayments. A loan plan is assigned by borrowing history; it is not a tax-saving option you can choose.
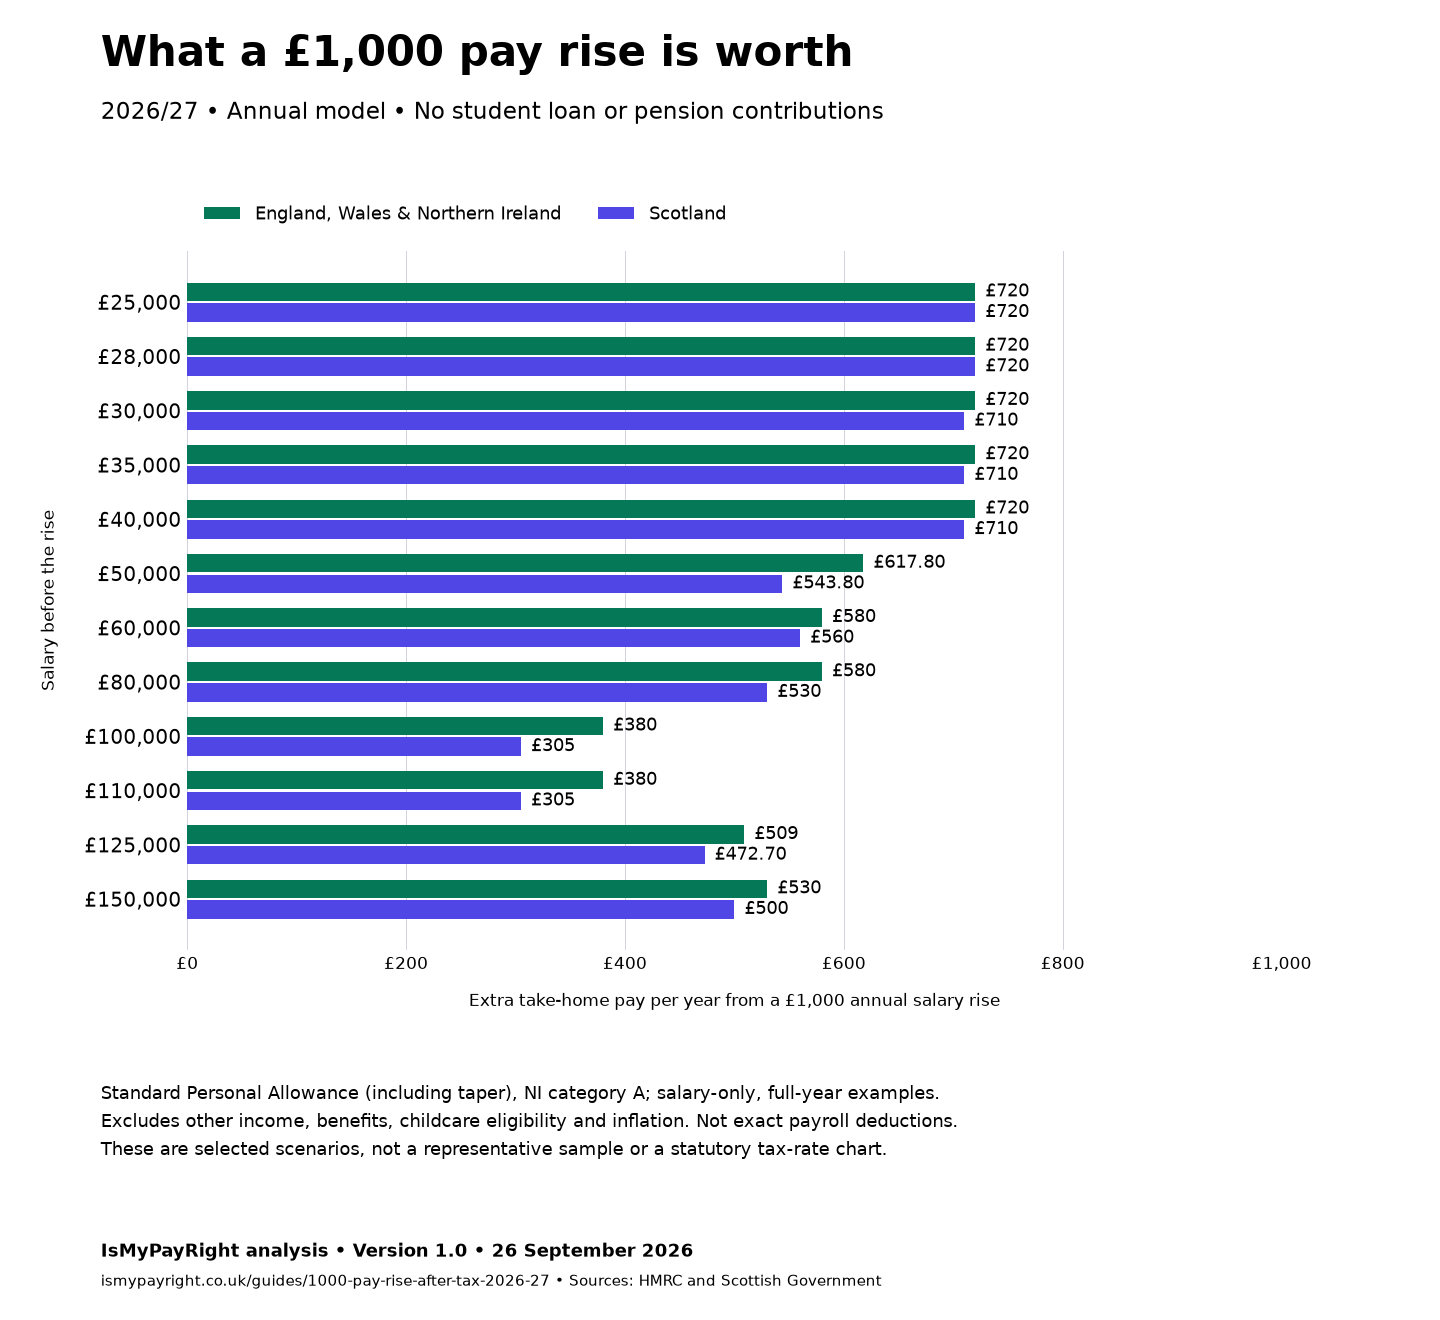
2. Crossing a threshold needs a split calculation. From £50,000 to £51,000 in England, Wales or Northern Ireland, with no loans, extra Income Tax is £346 and extra NI is £36.20, leaving £617.80. The first £270 and remaining £730 of the rise fall on different sides of £50,270. Applying the new marginal rate to the whole £1,000 misses this.
3. The allowance taper reduces what you keep from extra pay. From £110,000 to £111,000, the salary-only no-loan result is £380 in England, Wales or Northern Ireland and £305 in Scotland. With Plan 2 and postgraduate repayments it becomes £230 and £155 respectively. Those are incremental pay differences, not tax rates on the whole salary. Student-loan deductions are repayments, not Income Tax.
England, Wales and Northern Ireland: extra take-home from £1,000
Each cell shows extra annual take-home pay, then its monthly equivalent. All figures exclude pension contributions. Scroll the table sideways on a narrow screen. Four loan arrangements are shown here; the complete dataset includes every listed plan with and without postgraduate repayments.
| Starting salary | No loan | Plan 2 | Plan 5 | Plan 2 + postgraduate |
|---|---|---|---|---|
| £25,000 | £720.00 £60.00/month | £720.00 £60.00/month | £630.00 £52.50/month | £660.00 £55.00/month |
| £28,000 | £720.00 £60.00/month | £720.00 £60.00/month | £630.00 £52.50/month | £660.00 £55.00/month |
| £30,000 | £720.00 £60.00/month | £630.00 £52.50/month | £630.00 £52.50/month | £570.00 £47.50/month |
| £35,000 | £720.00 £60.00/month | £630.00 £52.50/month | £630.00 £52.50/month | £570.00 £47.50/month |
| £40,000 | £720.00 £60.00/month | £630.00 £52.50/month | £630.00 £52.50/month | £570.00 £47.50/month |
| £50,000 | £617.80 £51.48/month | £527.80 £43.98/month | £527.80 £43.98/month | £467.80 £38.98/month |
| £60,000 | £580.00 £48.33/month | £490.00 £40.83/month | £490.00 £40.83/month | £430.00 £35.83/month |
| £80,000 | £580.00 £48.33/month | £490.00 £40.83/month | £490.00 £40.83/month | £430.00 £35.83/month |
| £100,000 | £380.00 £31.67/month | £290.00 £24.17/month | £290.00 £24.17/month | £230.00 £19.17/month |
| £110,000 | £380.00 £31.67/month | £290.00 £24.17/month | £290.00 £24.17/month | £230.00 £19.17/month |
| £125,000 | £509.00 £42.42/month | £419.00 £34.92/month | £419.00 £34.92/month | £359.00 £29.92/month |
| £150,000 | £530.00 £44.17/month | £440.00 £36.67/month | £440.00 £36.67/month | £380.00 £31.67/month |
Scotland: extra take-home from £1,000
The Scottish table changes Income Tax treatment and keeps the other assumptions the same. Your current tax region does not determine your loan plan; use the plan associated with your borrowing. The columns are scenarios, not a recommendation or a claim about which loans Scottish residents usually have.
| Starting salary | No loan | Plan 2 | Plan 5 | Plan 2 + postgraduate |
|---|---|---|---|---|
| £25,000 | £720.00 £60.00/month | £720.00 £60.00/month | £630.00 £52.50/month | £660.00 £55.00/month |
| £28,000 | £720.00 £60.00/month | £720.00 £60.00/month | £630.00 £52.50/month | £660.00 £55.00/month |
| £30,000 | £710.00 £59.17/month | £620.00 £51.67/month | £620.00 £51.67/month | £560.00 £46.67/month |
| £35,000 | £710.00 £59.17/month | £620.00 £51.67/month | £620.00 £51.67/month | £560.00 £46.67/month |
| £40,000 | £710.00 £59.17/month | £620.00 £51.67/month | £620.00 £51.67/month | £560.00 £46.67/month |
| £50,000 | £543.80 £45.32/month | £453.80 £37.82/month | £453.80 £37.82/month | £393.80 £32.82/month |
| £60,000 | £560.00 £46.67/month | £470.00 £39.17/month | £470.00 £39.17/month | £410.00 £34.17/month |
| £80,000 | £530.00 £44.17/month | £440.00 £36.67/month | £440.00 £36.67/month | £380.00 £31.67/month |
| £100,000 | £305.00 £25.42/month | £215.00 £17.92/month | £215.00 £17.92/month | £155.00 £12.92/month |
| £110,000 | £305.00 £25.42/month | £215.00 £17.92/month | £215.00 £17.92/month | £155.00 £12.92/month |
| £125,000 | £472.70 £39.39/month | £382.70 £31.89/month | £382.70 £31.89/month | £322.70 £26.89/month |
| £150,000 | £500.00 £41.67/month | £410.00 £34.17/month | £410.00 £34.17/month | £350.00 £29.17/month |
A chart you can reuse
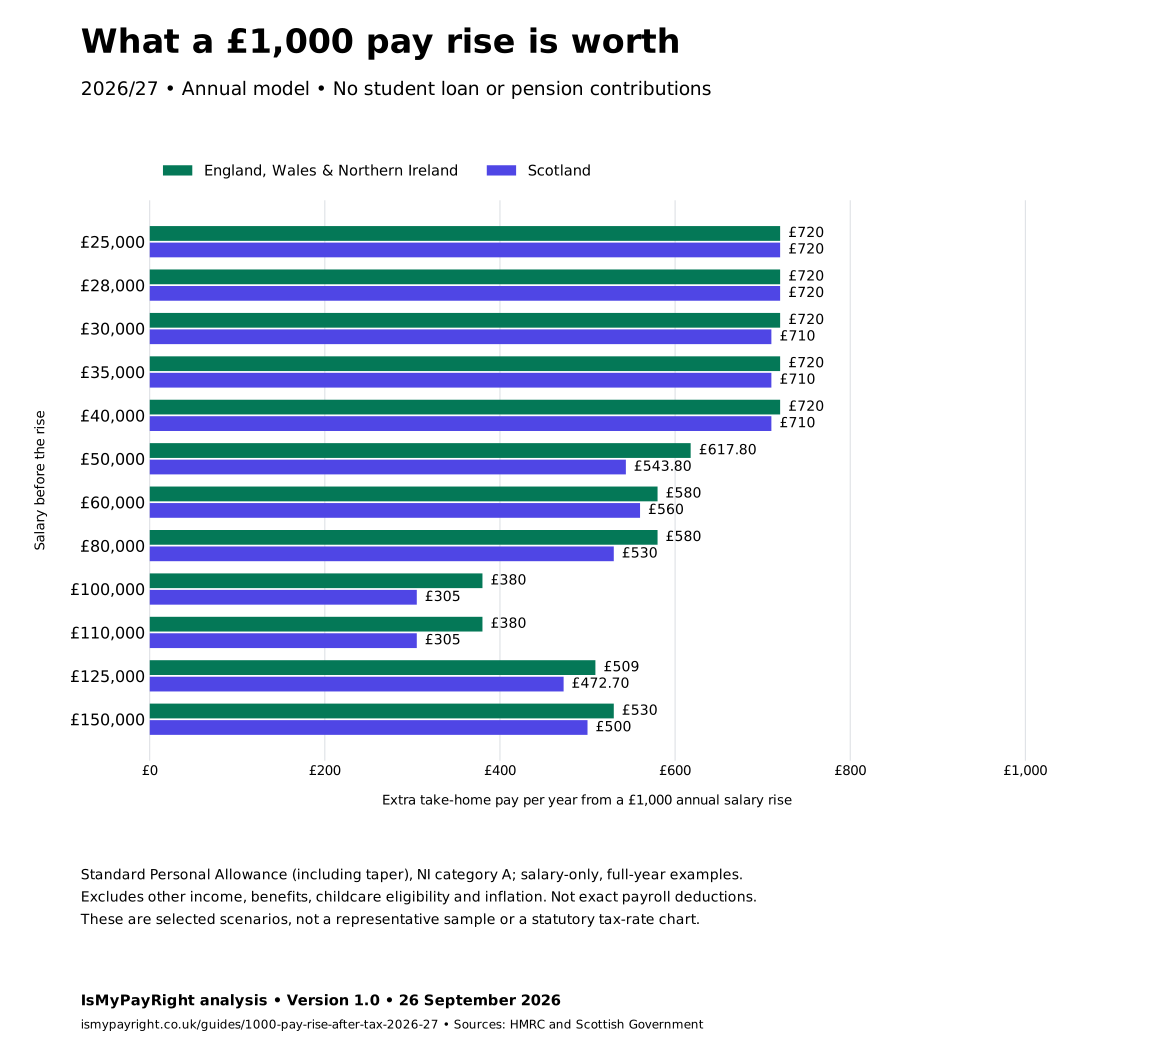
The chart isolates the no-loan, no-pension comparison. Full figures for the loan scenarios are in the tables and downloadable data. Open the image for a larger view.
Reproduce a result
The method is take-home after the rise − take-home before the rise. For each case we run the same annual calculator twice, changing salary alone. Deduction differences are rounded to pence; the monthly equivalent is the annual net difference divided by 12 and rounded to two decimals.
Reproduce the £30,000 example with Plan 2 and postgraduate loans: open the £30,000 before calculation and open the £31,000 after calculation. Compare annual take-home pay: the £570 difference is £47.50 a month on an annual-equivalent basis. You can change the inputs for your own circumstances.
For the £110,000 Scottish example with Plan 2 and postgraduate loans, the £1,000 rise adds £675 Income Tax, £20 employee NI and £150 loan repayments. £1,000 − £675 − £20 − £150 = £155 extra take-home pay a year. The £675 combines tax on the extra income and the effect of losing £500 of Personal Allowance; it is not a statutory 67.5% tax band.
Download the data, cite the analysis and check its limits
Download all 240 scenarios as JSON. The file contains the assumptions, sources, units, loan definitions, before/after salaries and net pay, each deduction difference, and calculator links. It is a fixed version 1.0 snapshot, not a live feed. For an independent calculation of the same published rules, download the Python reproduction script and save it beside the JSON file. It uses only the Python standard library, requires no account or network access, and checks all 240 results. This is a separate reference calculation, not an independent professional review.
Suggested credit: IsMyPayRight, “What a £1,000 Pay Rise Is Worth After Tax in 2026/27”, version 1.0, published 26 September 2026. Link to this report so readers can see the assumptions. The original analysis, tables and chart may be reused with credit and a link; keep the tax year and assumptions attached. Official source material retains its own terms.
Annual loan estimates do not reproduce payroll’s whole-pound deductions each period. A loan ending during the year, a different NI category, a tax-code adjustment, pension contributions or other income can change the answer. These figures also do not estimate lifetime loan cost or the effect of eventual write-off. The chosen salary points are examples, so do not describe the smallest value here as the lowest possible UK outcome.
Sources were checked on 26 September 2026. We have not claimed an independent professional review or official endorsement. For corrections, use the published corrections process. For the wider calculation approach, read our methodology.
What to check
- Use the salary before the rise, your tax region and the loan plan assigned to you.
- The comparison holds everything except annual gross salary constant.
- Pension contributions and household support are excluded; add your own circumstances before deciding.
What to do next
- Read the annual result first; the monthly figure is that amount divided by 12.
- Open the before and after calculations to reproduce an example.
- Keep the tax year, assumptions and source link attached when reusing a figure.
Try the tool
Check your payslip or model a change.
Use the checker if you already have a payslip. Use the calculator if you want to model take-home pay or salary-sacrifice changes before payday.
About this guide
Published by IsMyPayRight to help you understand pay and deductions. Guides use official reference material and practical examples, with AI assistance in content preparation.
This is general guidance, not a professional review of your circumstances. Read our editorial process and corrections information.
Official sources
Official sources
Use these references to check the rules behind this guide. Check the tax year and your circumstances before applying an example to your own pay.