Guide
A £1,000 Pay Rise at ONS Earnings Benchmarks: 2026/27 Analysis
A headline salary increase tells you little about the extra money you can use. We took five annual gross earnings benchmarks from the new ONS release and modelled a £1,000 rise at each, keeping tax residency and student-loan assumptions explicit.
Quick answer
At the ONS full-time annual median benchmark of £40,911.20, a hypothetical £1,000 rise leaves £720 a year in England, Wales or Northern Ireland, or £710 under Scottish Income Tax, with no pension or student loan. With Plan 2 and postgraduate repayments, those figures become £570 and £560. These are modelled changes at gross benchmarks, not observed median take-home pay.
On this page
What the benchmarks mean
Published 24 October 2026 · Version 1.0. We use the 10th, 25th, 50th (median), 75th and 90th percentiles from ONS ASHE Table 1.7a, Full-Time sheet. These are UK employee-job annual gross earnings on adult rates for people in the same job for more than a year. Annual earnings cover the tax year ended 5 April 2026, including pay affected by absence. They are not weekly earnings multiplied by 52.
The release is dated 22 October 2026 and remains provisional. The corresponding Table 1.7b coefficients of variation are 0.2%, 0.2%, 0.2%, 0.4% and 0.8%; none of our five cells is suppressed. We retain the published precision. These percentiles describe gross earnings within that population. They do not show how many people would receive the modelled rise.
Three practical findings
The median benchmark is still a scenario. At £40,911.20 rising to £41,911.20, the England/Wales/Northern Ireland no-loan model keeps £720 of the extra £1,000: £200 goes to Income Tax and £80 to employee NI. The £60 monthly equivalent is £720 divided by 12. It is not a forecast of the next payslip.
Loan repayments can reduce the extra cash without changing your tax band. At that same benchmark, Plan 5 leaves £630 a year and Plan 2 plus postgraduate repayments leave £570. Loans are assigned by borrowing history and repayments are not Income Tax. This does not estimate lifetime repayment cost or whether the debt will be written off.
The tax region matters at higher gross benchmarks. At the £82,679.70 90th-percentile benchmark, the no-loan rise leaves £580 in England, Wales or Northern Ireland and £530 in the Scottish scenario. The UK earnings source does not identify tax residency: both are explicitly modelled alternatives at the same gross amount.
Check your own pay rise
Official gross benchmarks give context. Compare the salaries and assumptions that apply to you.
England, Wales and Northern Ireland: annual rise after deductions
Each cell gives extra annual take-home and its monthly equivalent. All scenarios exclude pension contributions. Scroll the table on a narrow screen. Use only a loan arrangement that actually applies to you.
| ONS annual gross benchmark before rise | No student loan | Plan 5 | Plan 2 and postgraduate |
|---|---|---|---|
| 10th percentile £25,288.00 gross | £720.00 a year £60.00 monthly equivalent | £630.00 a year £52.50 monthly equivalent | £660.00 a year £55.00 monthly equivalent |
| 25th percentile £30,599.60 gross | £720.00 a year £60.00 monthly equivalent | £630.00 a year £52.50 monthly equivalent | £570.00 a year £47.50 monthly equivalent |
| Median £40,911.20 gross | £720.00 a year £60.00 monthly equivalent | £630.00 a year £52.50 monthly equivalent | £570.00 a year £47.50 monthly equivalent |
| 75th percentile £56,842.20 gross | £580.00 a year £48.33 monthly equivalent | £490.00 a year £40.83 monthly equivalent | £430.00 a year £35.83 monthly equivalent |
| 90th percentile £82,679.70 gross | £580.00 a year £48.33 monthly equivalent | £490.00 a year £40.83 monthly equivalent | £430.00 a year £35.83 monthly equivalent |
Scotland: the same gross benchmarks, different tax treatment
This changes Income Tax residency alone. It does not turn the UK benchmarks into a Scottish earnings distribution or infer residency from workplace location.
| ONS annual gross benchmark before rise | No student loan | Plan 5 | Plan 2 and postgraduate |
|---|---|---|---|
| 10th percentile £25,288.00 gross | £720.00 a year £60.00 monthly equivalent | £630.00 a year £52.50 monthly equivalent | £660.00 a year £55.00 monthly equivalent |
| 25th percentile £30,599.60 gross | £710.00 a year £59.17 monthly equivalent | £620.00 a year £51.67 monthly equivalent | £560.00 a year £46.67 monthly equivalent |
| Median £40,911.20 gross | £710.00 a year £59.17 monthly equivalent | £620.00 a year £51.67 monthly equivalent | £560.00 a year £46.67 monthly equivalent |
| 75th percentile £56,842.20 gross | £560.00 a year £46.67 monthly equivalent | £470.00 a year £39.17 monthly equivalent | £410.00 a year £34.17 monthly equivalent |
| 90th percentile £82,679.70 gross | £530.00 a year £44.17 monthly equivalent | £440.00 a year £36.67 monthly equivalent | £380.00 a year £31.67 monthly equivalent |
Share the chart with its assumptions
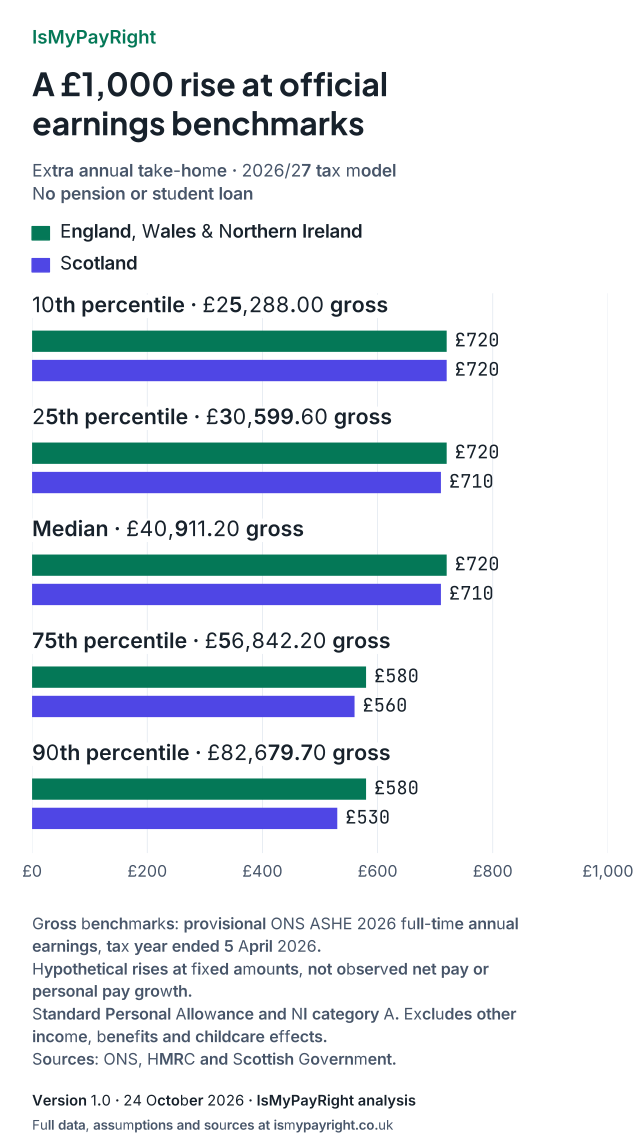
The chart isolates the no-pension, no-student-loan comparison. Values also appear in the preceding accessible tables.
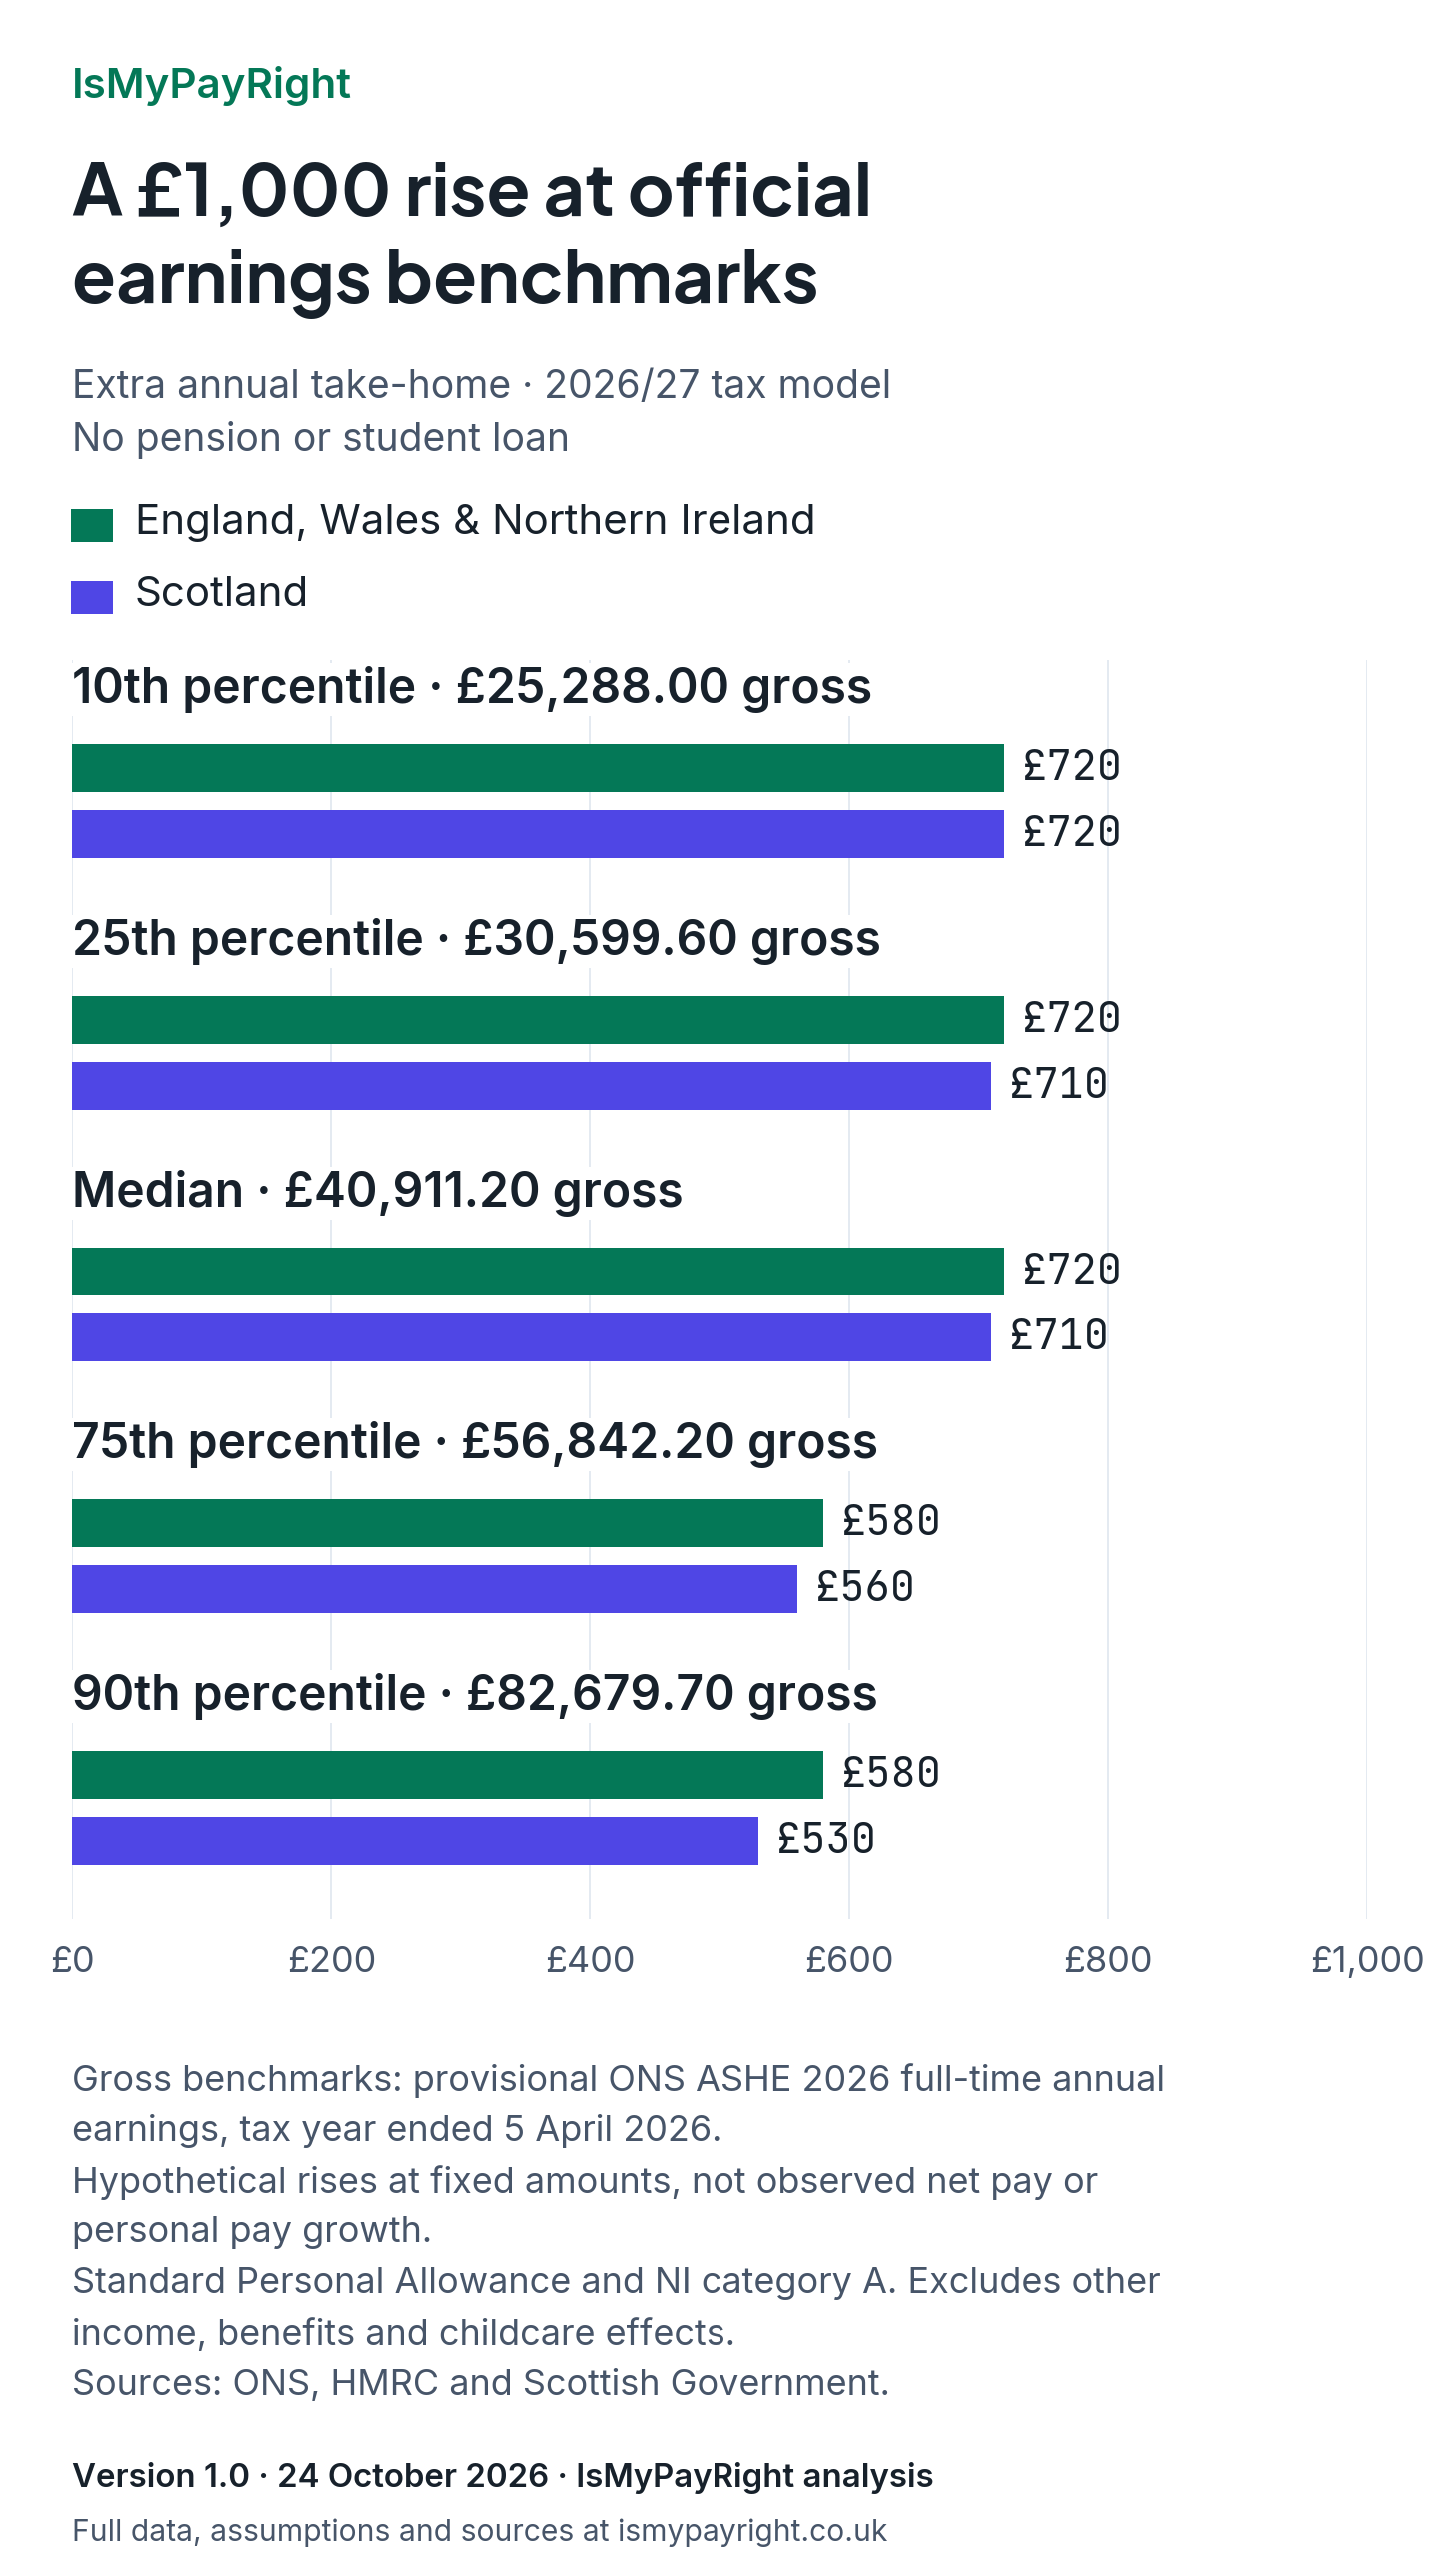
Download PNG · Download SVG. Credit IsMyPayRight and link to this report. Keep the provisional ONS label, tax year and assumptions. ONS source data retain their Open Government Licence terms.
Reproduce the analysis and check the limits
Download all 30 modelled scenarios: five frozen benchmarks × two tax regimes × three loan arrangements. Download the source-cell register, the unchanged earnings workbook and quality workbook. SHA-256 checksums and exact sheet/cell identities are recorded. Save the JSON and workbooks beside the Python reproduction script; it uses the standard library, checks the frozen source cells and independently calculates all 30 results without an account or network.
We model hypothetical full-year salaries at the unchanged gross benchmarks under 2026/27 rules. This is not an observed net-pay distribution, a measure of personal pay growth, an inflation adjustment or a comparison of actual 2025/26 and 2026/27 earnings. Standard Personal Allowance and NI category A apply. There is no pension, salary sacrifice, other income, benefit in kind or special tax code. Loan deductions apply throughout with sufficient balances. Annual figures do not reproduce payroll’s period rounding or year-to-date PAYE history.
Excluded: benefit withdrawal, the Child Benefit charge, childcare eligibility, household costs and employer costs. These can matter when deciding whether extra pay or hours leave you better off. Use the pay-rise explorer for your salary and pension assumptions, and the offer tool for commuting costs and time.
Sources and calculations checked 24 October 2026 by Codex; this is not independent professional review or ONS endorsement. The frozen version will not silently change with a later ONS revision. Corrections will receive a dated version and update the chart and distribution pack. Use the published corrections process to report a problem.
What to check
- The ONS inputs are provisional annual gross figures for employee jobs, not current individual salaries.
- Our full-year before/after model uses 2026/27 tax rules and holds other assumptions constant.
- Pension contributions, benefit withdrawal and household costs can materially change your own result.
What to do next
- Find the benchmark nearest your gross pay, then read the tax and loan scenario that applies.
- Use your actual salaries in the pay-rise explorer before making a decision.
- Keep provisional-data status, tax year and assumptions attached when sharing the chart.
Try the tool
Check your payslip or model a change.
Use the checker if you already have a payslip. Use the calculator if you want to model take-home pay or salary-sacrifice changes before payday.
About this guide
Published by IsMyPayRight to help you understand pay and deductions. Guides use official reference material and practical examples, with AI assistance in content preparation.
This is general guidance, not a professional review of your circumstances. Read our editorial process and corrections information.
Methodology and sources
See how the calculations work, which sources they use, how results are tested, and which payroll details the estimates cannot verify.
Common questions
- Is this the average UK take-home pay?
- No. The source gives provisional annual gross earnings benchmarks for UK full-time employee jobs. We model a hypothetical £1,000 rise at each benchmark under 2026/27 rules. We do not observe a net-pay distribution or estimate median take-home pay.
- Why are 2026 ONS figures used with 2026/27 tax rules?
- ONS annual earnings concern the tax year ended 5 April 2026. We hold those published gross amounts fixed as benchmarks and ask what a hypothetical full-year rise would leave under 2026/27 rules. This is not a comparison of actual earnings across the two years.
- Does the model include pensions or changes to benefits?
- No. It includes Income Tax, standard employee NI and the stated loan repayments. Pensions, salary sacrifice, benefit withdrawal, Child Benefit charge and childcare eligibility are excluded. Your circumstances can change the result.
Official sources
Official sources
Use these references to check the rules behind this guide. Check the tax year and your circumstances before applying an example to your own pay.
- ASHE Table 1: 2026 provisional annual gross earnings and coefficients of variation
ONS
- Employee earnings in the UK: 2026, definitions and limitations
ONS
- 2026/27 Income Tax, National Insurance and loan thresholds
HMRC
- Scottish Income Tax rates and bands, 2026/27
Scottish Government
- Student-loan repayments and assigned plans
GOV.UK